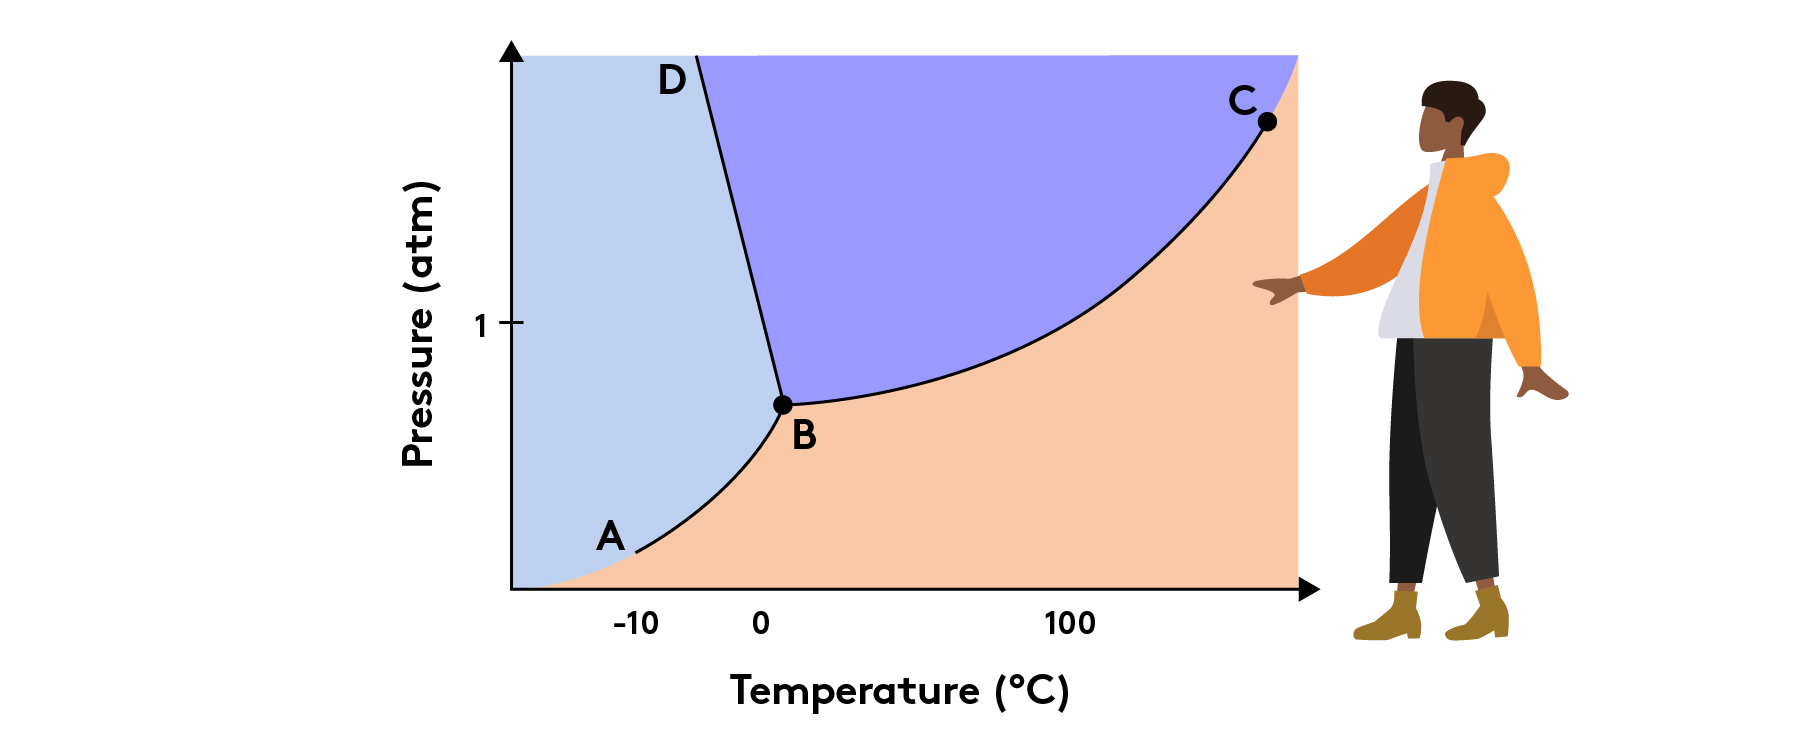
In this webinar, we will review the two main diagrams of phase changes and thermodynamics. These are phase diagrams (solid, liquid, gas) and heating curves. Phase diagrams can give us useful info about densities, boiling and melting curves, and can also help explain colligative properties. Heating curves show quantitatively how phases can change. We use heating curves in calorimetry.
Phases


